In the previous installment of my ongoing "Media Metrics" series, I highlighted the radical metamorphosis taking place in the market for audible information and entertainment. I showed that this previously stable sector now finds itself in a state of seemingly constant upheaval, especially thanks to the blistering pace of technological change we are witnessing today.
In this sixth installment of the Media Metrics series, we will see how a similar transformation has taken place in the video marketplace over the past three decades. Again, using the analytical framework I presented in the first installment, we will see that today we have more choice, competition, and diversity in every part of the video value chain. [You might also be interested in reviewing the third installment in this series dealing with advertising competition and the fourth installment dealing with changing media fortunes.]
Kenneth Goldstein of Winnipeg, Canada-based Communications Management, Inc., has put together a set of enlightening television value chains that compares the state of the marketplace in 1975 to present.
Exhibit 1

Exhibit 2
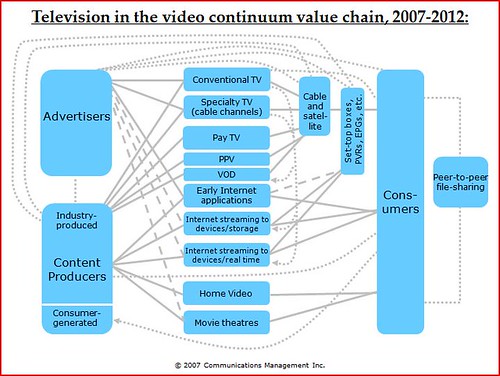
Goldstein’s diagrams illustrate the amazing changes that have taken place over the past quarter century in terms of the added layers of visual content and video distribution / delivery options. But the visual revolution has actually been much more profound that even those charts suggest. The very form and nature of video creation and consumption has changed in recent years as well. This is nicely demonstrated in this slide put together by media futurist Gerd Leonhard, who has highlighted the major differences between “old TV†and “TV 2.0†in his work.
Exhibit 3
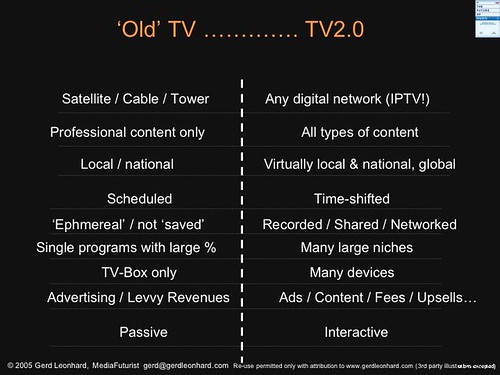
As Leonhard’s exhibit makes clear, the old video world could be characterized as passive, linear, scheduled, and dominated by “professional†content. In that environment, video producers called the shots. The old order has now been upended and our new video marketplace is interactive, unscheduled, and time-shifted, with abundant professional and amateur content available. Today, video consumers call the shots.
The fundamental driver of the video revolution has been the technological innovation we have seen at work in every layer of the media value chain. That has resulted in an age of scarcity giving way to an age of abundance.
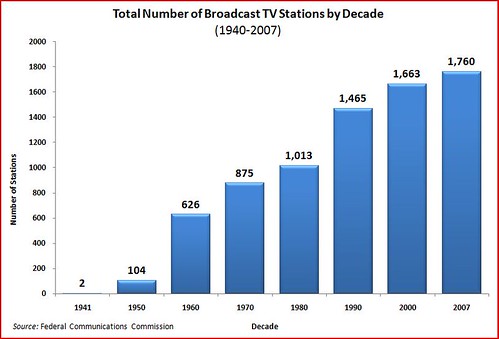
Consider what the rise of media abundance has meant for the oldest video platform--broadcasting. There was a time, not that long ago, when broadcasting was synonymous with television. Some of us are old enough to remember an era when 3 or 4 VHF channels (and perhaps a few fuzzy UHF channel) constituted the extent of the video experience in our homes. Those days are forever gone. Looking just at the growth of broadcast outlets over the past few decades, however, we see that the number of stations has roughly doubled since 1970.
Exhibit 4
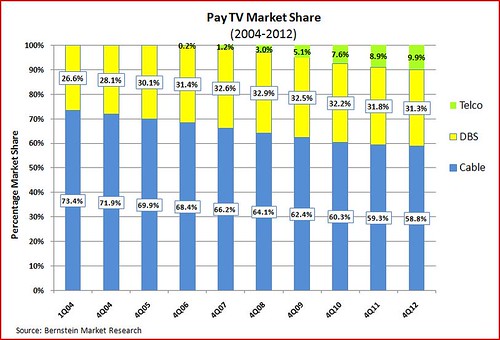
Of course, in each of the next three decades, a major new video distribution provider would appear on the scene. Cable in the late 70s & early 80s; satellite in 90s; and telco video in this decade. Today, these “multichannel video distribution services†are subscribed to by 86% of Americans. Exhibit 5 illustrates the respective shares of each type of pay TV provider and makes it clear that satellite and telco companies are increasingly eating into cable’s early lead.
Exhibit 5
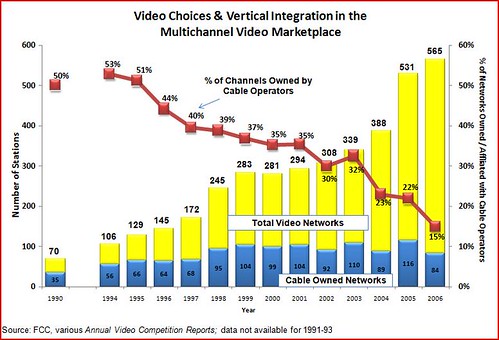
What has this meant for consumers? First, the proverbial “500-channel†cable universe we used to just talk about is now a reality. The overall number of video programming channels available in America has skyrocketed, from just 70 channels in 1990 to 565 channels in 2006.
Moreover, contrary to what some critics have claimed, the video marketplace is not excessively concentrated or controlled by “gatekeepers.†Indeed, vertical integration in the video marketplace has plummeted. The greatest share of the growth in the multichannel video marketplace has come from independently-owned video networks. Since 1990, the number of cable-owned or affiliated channels has increased slightly, but it pales in comparison to the growth of independently-owned and operated video networks. In real terms, therefore, the percentage of the overall video marketplace controlled (i.e., owned and operated) by cable has plummeted--from 50% in 1990 to just 14.9% today. As far as vertically integrated industries go, it is impossible to conclude that this one could be characterized as being controlled by “gatekeepers.†Exhibit 6 illustrates these trends of greater programming options and decreasing video integration.
Exhibit 6
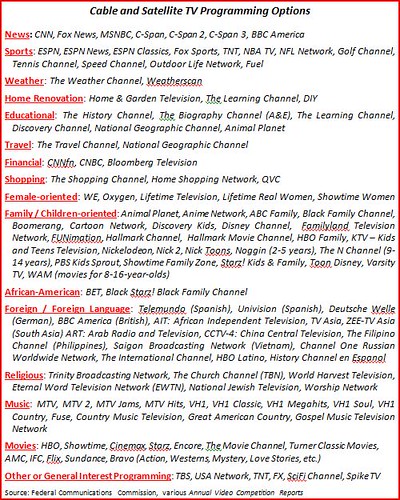
The resulting diversity “on the dial†has been truly breathtaking. There really isn’t any human interest or hobby that is NOT currently covered by some video network. As the FCC concluded in its 2003 Media Ownership Proceeding: “We are moving to a system served by literally hundreds of networks serving all conceivable interests.†Exhibit 7 shows the sheer diversity of niche programming on pay TV today.
Exhibit 7
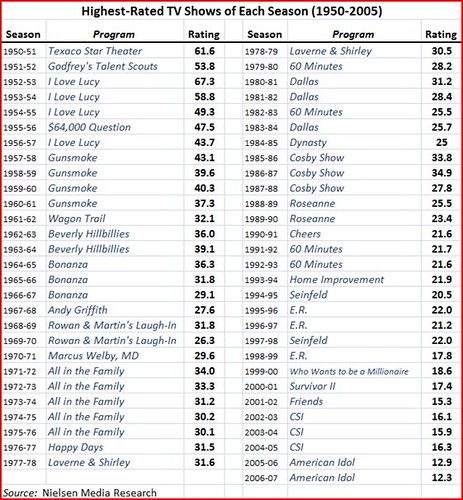
All this new choice has meant that the viewing audience is more fragmented than ever before. In the 1950s, the top shows on television garnered 40-50% of the viewing audience. By the 1970s, the top shows were still pulling in over 30% of the audience. Today, however, with so many other media options vying for attention, the top shows on TV are lucky to break 15%. Exhibit 8 lists the top-rated shows on TV from 1950-2005 and illustrates just how splintered the audience has become in the battle for “attention share.â€
Exhibit 8
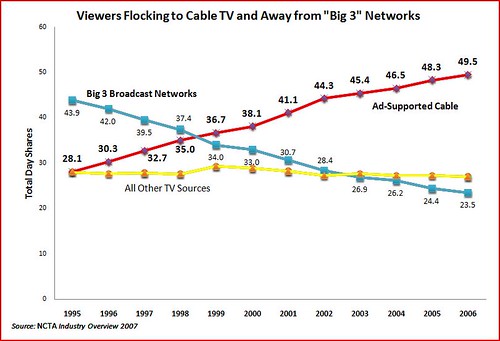
For broadcast networks, these trends have been devastating. Broadcast TV networks have lost primetime market share every year for the past 25 years. Exhibit 9 illustrates that the “Big 3†networks, which had a 90 share of the primetime market in 1980, control only a 32 share today. Exhibit 10 is another cut at the same thing using day shares, and it shows that since the late 1990s, cable has dominated broadcasting.
Exhibit 9
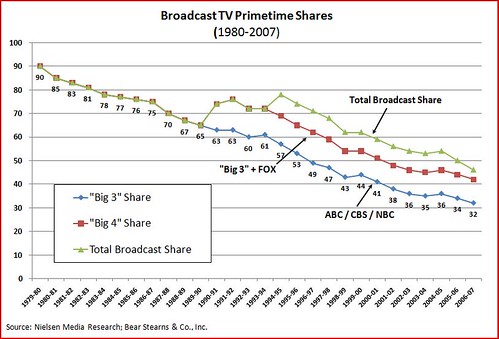
Exhibit 10
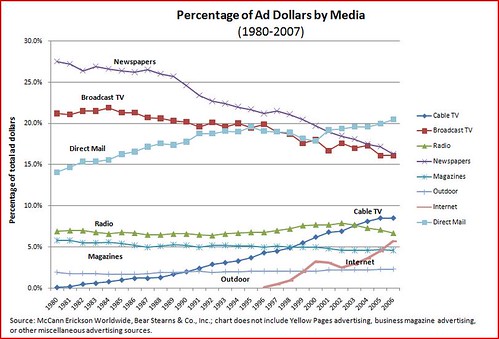
As a result, cable and other forms of media have been gaining ground in the advertising market. Although broadcasters still command a very respectable share of overall advertising dollars, the sectors cut of the pie has been steadily falling every year for the past decade. This power shift in the ad market is important because broadcast television is largely reliant upon advertising to sustain its creative endeavors. Cable, satellite, telco, Internet and other video providers all have other financing options, namely, subscribers. This has many industry analysts wondering whether broadcasting’s old “free, over-the-air†business model is sustainable.
Exhibit 11
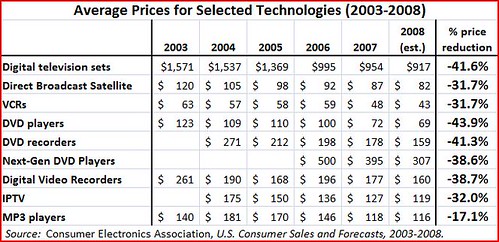
It’s also worth noting the many other ways that consumers have been empowered by various new technologies. New video empowerment technologies—such as digital video recorders (DVRs), video on demand (VOD), VCRs and DVD players—have revolutionized the way we consume visual media by giving viewers unprecedented control over their viewing preferences and timetables. Of course, it is also true that while these technologies have empowered viewers, they have presented new challenges for traditional media operators who primarily rely on advertising to support content creation / distribution. Regardless, this empowerment revolution shows no signs of abating and will continue to reshape the video marketplace. The following exhibits document the growth of these tools and the falling cost of them.
Exhibit 12
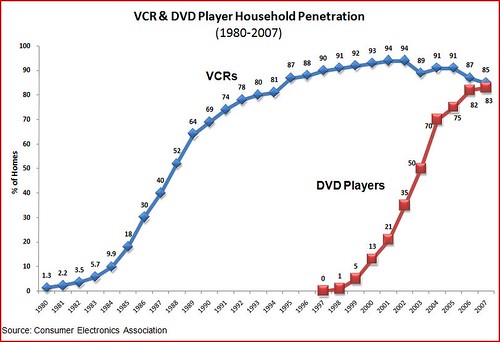
Exhibit 13
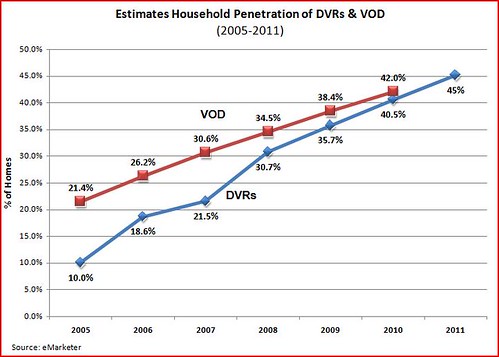
Exhibit 14
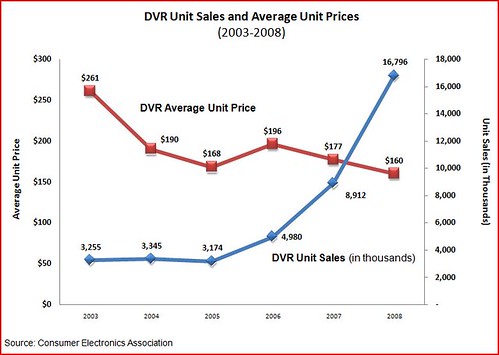
Exhibit 15
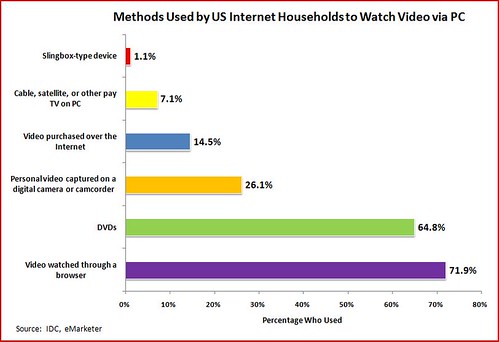
And, finally--as I end up saying in each of these installments--“Then there’s the Internet.†The Internet and online / interactive technologies have contributed more to the revolutionary changes we have seen at work in the market for visual news, information, and entertainment than all other sectors and factors combined. The next four exhibits illustrated the growth of Internet video content and online video consumption in general.
Exhibit 16
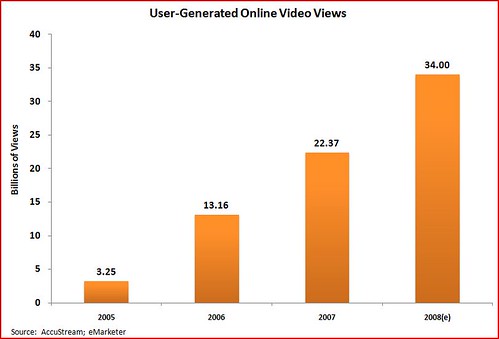
Exhibit 17
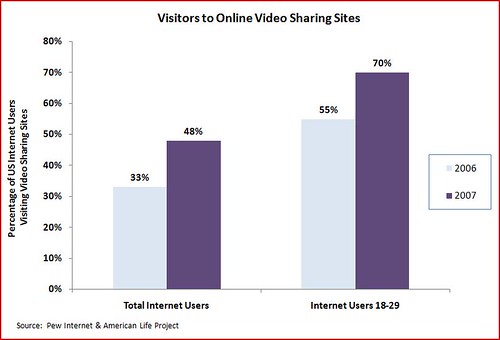
Exhibit 18
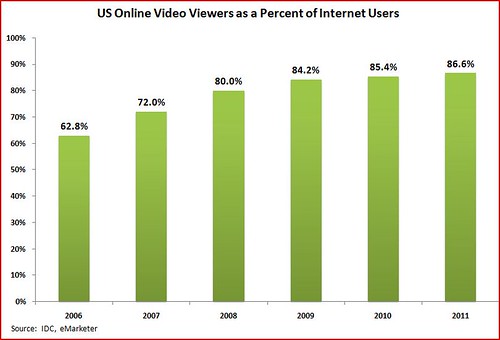
Exhibit 19
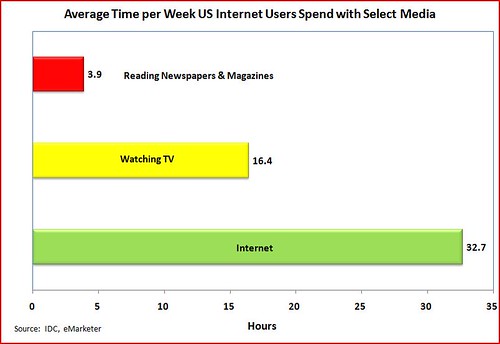
And this final chart suggests that consumers are increasingly spending more time online and less time using traditional media sources. Again, that’s the substitution effect at work at again, which has been a reoccurring theme of this series.
Exhibit 20
As was the case for audible media, the exhibits and statistics shown here reveal that there has never been more cut-throat competition and consumer choice in the world of video information and entertainment. And things are getting better all the time.
[P.S. All of the charts and tables that have been a part of this ongoing “Media Metrics†series are available on my Flickr account.]